
Amazon’s October Prime event ran on Tuesday 6 and Wednesday 7 October 2026. Most of what gets posted about an event is a lift number on day one. We waited a week for Amazon’s reports to settle, then looked at the hours, the deals and the week after, across 30+ brands whose sales, traffic and advertising all land in one warehouse. Every number below comes from Amazon’s own reporting APIs. No client is named.
1. The headline, in one line
| Channel | Baseline per day (22 Sep – 5 Oct) | Event per day (6-7 Oct) | Lift |
|---|---|---|---|
| Seller (FBA) revenue | ~GBP 60k | ~GBP 182k | 3.1x |
| Seller units | 2,167 | 6,639 | 3.1x |
| Vendor (1P) UK ordered revenue | ~GBP 70k | ~GBP 130k | 1.9x |
| Vendor ordered units, UK | 4,274 | 8,273 | 1.9x |
| Vendor glance views | ~52k | ~86k | 1.7x |
Seller brands run the deal programmes themselves and lifted harder. Vendor lines ride Amazon’s own merchandising and doubled. Day one out-sold day two on both channels, by 7 pct on the seller side and 3 pct on vendor. It is the least interesting number in this piece.
2. Year on year: a bigger lift on a flat baseline
Twenty-two seller accounts have complete data for both events (7-8 October 2025 and 6-7 October 2026). Their baseline revenue was flat year on year, at about GBP 48k a day both years. Their event lift went from 2.5x in 2025 to 3.1x in 2026; in units, from 2.8x to 3.1x. Vendor UK held: 1.92x in 2025, 1.87x in 2026. The seller side grew its event lift by about a quarter on the same base; the vendor side stood still.
3. Buyers bought before work on day one and after dinner on day two
The Amazon Marketing Stream gives us ad-attributed sales by the hour, for every campaign, across every account. Converted to pounds and indexed to an average hour in the week before, this is the shape of the event.
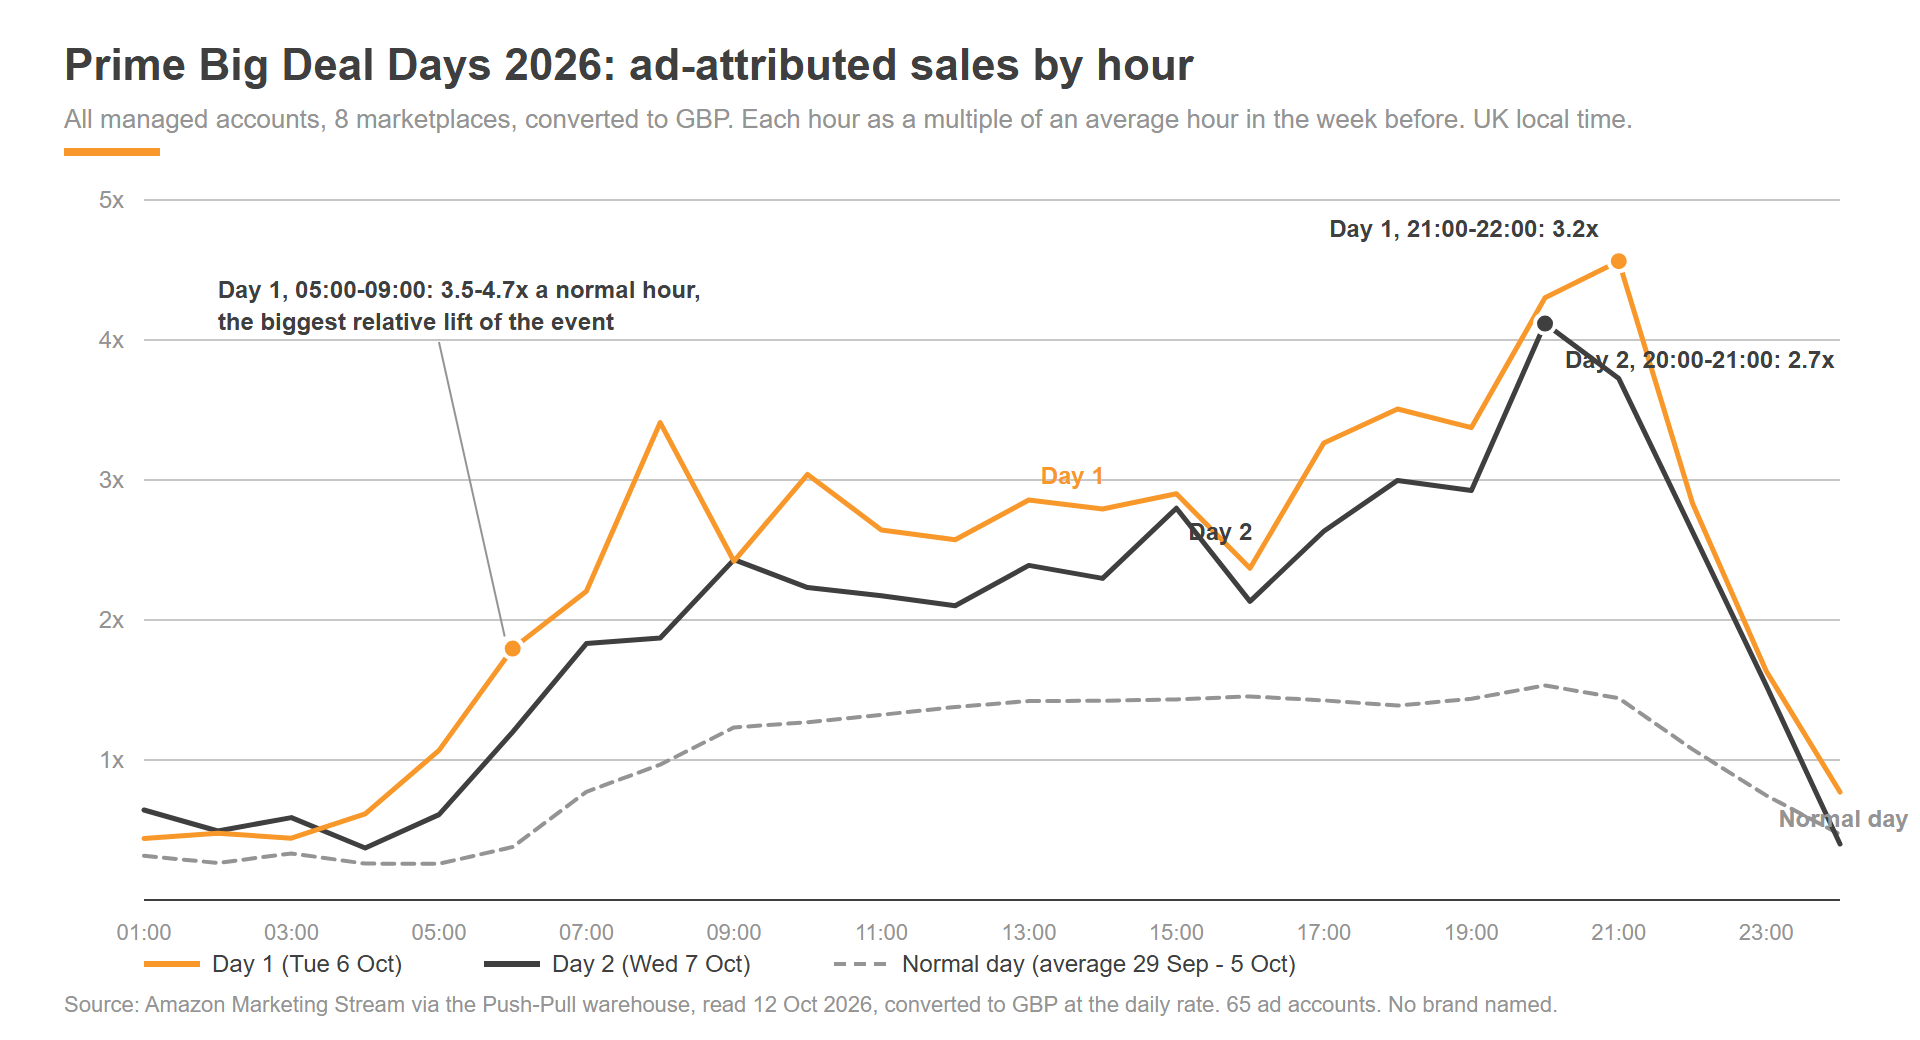
- The before-work surge. Between 05:00 and 09:00 UK on day one, ad-attributed sales ran at 3.5 to 4.7 times a normal hour, the biggest relative lift of the whole event. The deals had been live since midnight. People bought them over breakfast.
- The evening. 18:00 to 22:00 UK carried 28 pct of day-one and 29 pct of day-two ad sales, against 24 pct on a normal day. The 20:00 to 22:00 slot alone drew 2.8 times its normal clicks.
- Day one out-sold day two by a fifth in ad-attributed sales: GBP 171k against 143k, on a normal day of 73k. Day two was flatter and evening-led.
The shape differs by market. The UK was evening-led on both days. Germany was launch-driven: a single 09:00 deal launch ran at 14 times its normal hour on day one. The US ran at 1.4x all day with no peak; for a UK and EU book, the October event barely touches America.
4. What the whole of Amazon searched on the two days
Everything above is our accounts. This section is the whole marketplace. Amazon’s Brand Analytics Top Search Terms report, read at daily grain for Sunday 4 to Thursday 8 October, ranks every search on the marketplace that clears Amazon’s reporting threshold, about 65,000 searches a day in the UK, with the share of clicks the top product took. It describes all shoppers and all sellers, not our brands.
| Market | Day-one top 1,000 searches not in Monday’s top 1,000 | Day two | Thursday after (normal churn) | Day-one newcomers still in the top 1,000 on Thursday | Top product’s share of clicks on the top 1,000 searches, Mon / day 1 / day 2 |
|---|---|---|---|---|---|
| UK | 29 pct | 24 pct | 12 pct | 9 pct | 21.6 / 21.3 / 20.7 pct |
| Germany | 24 pct | 22 pct | 16 pct | 10 pct | 21.8 / 20.5 / 19.6 pct |
| US | 28 pct | 26 pct | 12 pct | 7 pct | 18.1 / 17.6 / 17.4 pct |
- The market searched for brands and categories, not products. In the UK “ninja” went from 70th to 6th, “tv” from 52nd to 20th, “laptop” from 36th to 16th and “apple watch” from 57th to 22nd. In Germany “apple” went from 124th to 12th. Shoppers arrived with a brand or a category in mind and let the deal grid choose the product. The biggest risers into the top 2,000 were beauty brands in the UK and the US and apparel categories and power-tool brands in Germany.
- People searched the event by name. “prime day deals 2026” rose from 2,529th to 371st in the UK; “prime day deals” from 283rd to 159th in the US; “prime day 2026 angebote” from 264th to 134th in Germany. The event-name searches are the cheapest reach of the two days for a Sponsored Brands placement.
- Seasonal demand was displaced, not added to. “halloween decorations” fell from 4th to 24th in the UK on day one and was back to 13th on day two.
- Clicks spread; they did not concentrate. The top product’s share of clicks on the thousand biggest searches fell by one to two points in all three markets. The deal grid puts more products in front of each search, and the incumbent’s grip loosens for two days. That is the window for a challenger line, on top of the 81 pct of clicks that already flow past the top three results on a normal day.
- The hangover shows at market level too. The number of distinct searches clearing Amazon’s threshold rose 45 pct in the UK and 55 pct in Germany on day one, then fell 10 to 12 pct below the pre-event level on Thursday. Nine in ten of the searches the event brought into the top 1,000 were gone again by Thursday.
Across the 40,000-plus searches our brands compete in, the weekly Search Query Performance panel shows total market search volume and purchases both up a tenth in the week before the event, measured the same way as our July Prime Day read. The marketplace was already building, not holding back.
5. Advertising: spend tripled, sales doubled, and that is the price of the event
| All accounts, GBP | Baseline per day | Event per day | Change |
|---|---|---|---|
| Ad spend | 12.8k | 36.9k | 2.9x |
| Ad-attributed sales | 65.7k | 152.2k | 2.3x |
| ACOS | 19.5 pct | 24.2 pct | +4.7 pts |
| Clicks | 28.2k | 65.1k | 2.3x |
| Cost per click | 0.455 | 0.567 | +25 pct |
| Click-to-order rate | 10.3 pct | 10.3 pct | flat |
| Orders | 2,912 | 6,682 | 2.3x |
The event did not make advertising more efficient. Conversion per click held exactly, clicks cost a quarter more, and ACOS rose five points. Advertising also took a larger share of the total: about 10p of every sales pound across seller and vendor during the event, against about 8p in the fortnight before. That is the price of a 3x day, and the arithmetic still works: the extra ad cost bought a volume of sales, rank and reviews (section 10) that the baseline fortnight does not deliver.
On the same basis in 2025, spend rose 2.3x and ad sales 1.8x with ACOS at 21.5 pct. This year pushed harder and got proportionally more back. Sponsored Products carried 95 pct of spend and sales; Sponsored Brands and Sponsored Display doubled with the market and no more. This is a Sponsored Products event.
6. CPC inflation was a European story
| Market | Baseline CPC (GBP) | Event CPC | Inflation | Click volume multiple |
|---|---|---|---|---|
| UK | 0.46 | 0.53 | +15 pct | 2.2x |
| Germany | 0.61 | 0.81 | +34 pct | 3.8x |
| Italy | 0.43 | 0.57 | +33 pct | 3.4x |
| Spain | 0.29 | 0.41 | +42 pct | 3.7x |
| France | 0.57 | 1.02 | +80 pct | 2.2x |
| US | 0.55 | 0.62 | +11 pct | 1.3x |
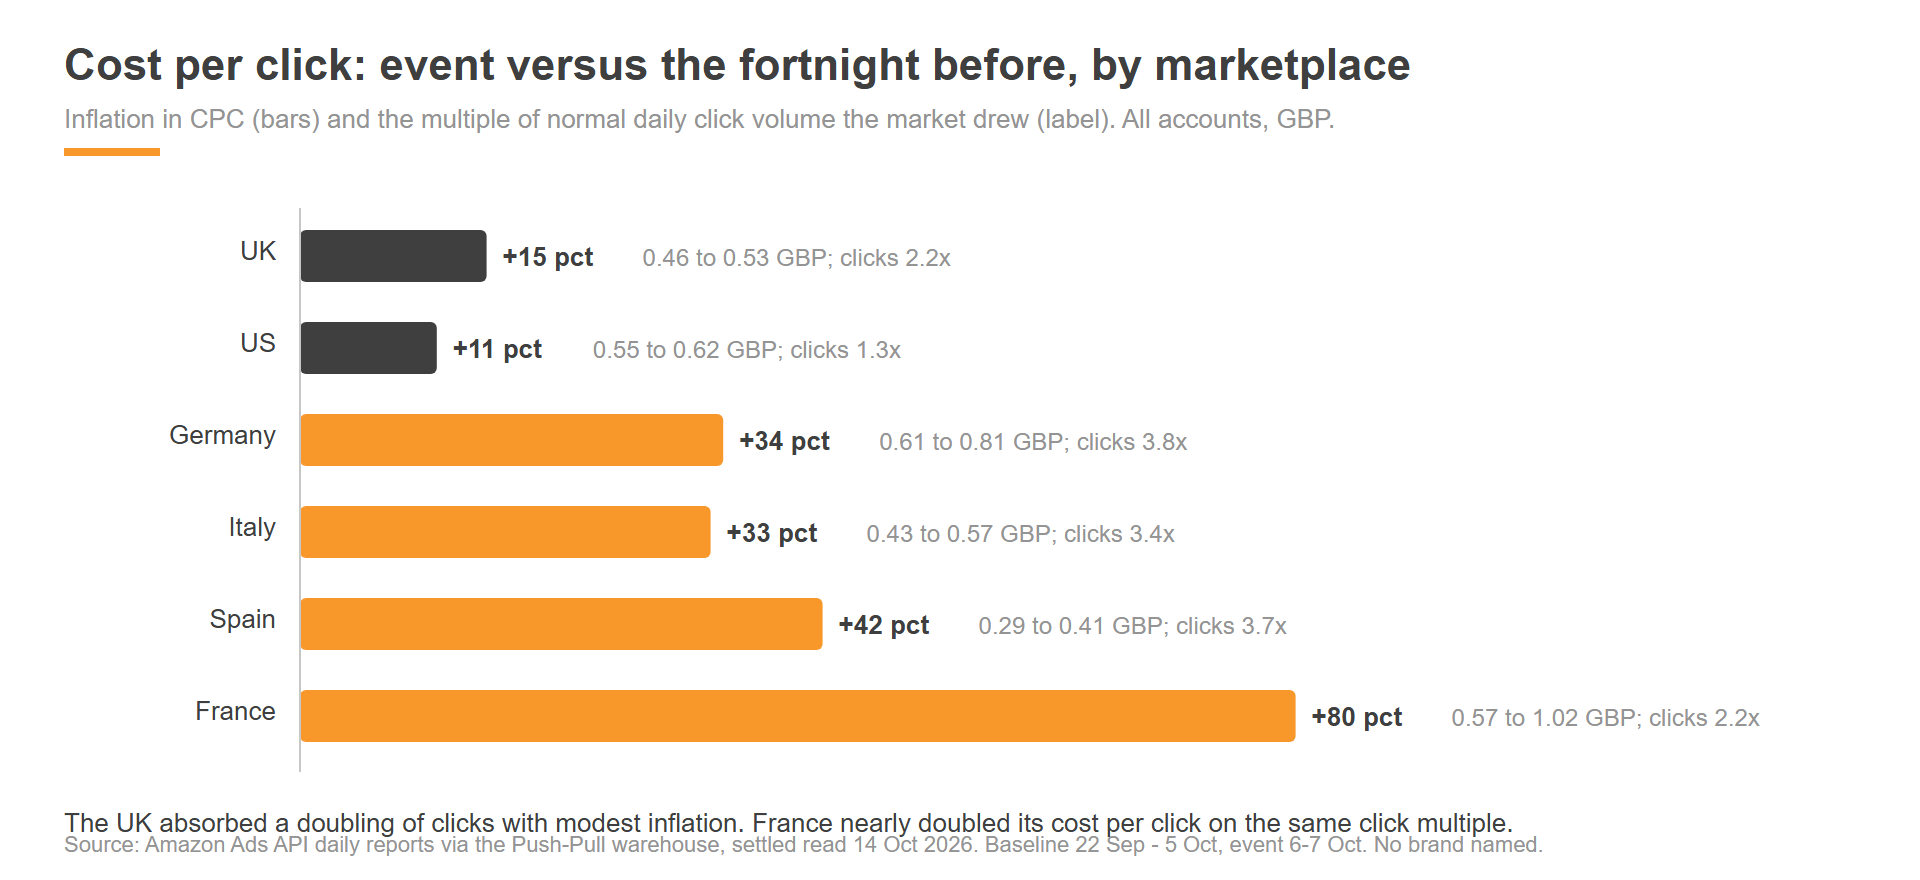
The UK auction absorbed a doubling of click volume with modest inflation. The smaller EU marketplaces got crowded fast: France nearly doubled its cost per click on the same click multiple as the UK. Every panel being quoted this month is US data, where clicks rose 11 pct; if you sell in Europe, the US read tells you almost nothing about what the event costs.
Talk to our experts. If you sell on Amazon and want this read on your own account before Black Friday, ask us about the Platinum Audit.
7. A daily budget is the wrong instrument on a deal day
Amazon’s intraday budget feed reports, for every campaign and every hour, how much of the day’s budget has gone. On a normal weekday a daily budget is exhausted on about one campaign in six before midnight. On day one of the event, with click volume at 2.3x, the share rose to one in four, and the exhaustion clustered in the hours that mattered.
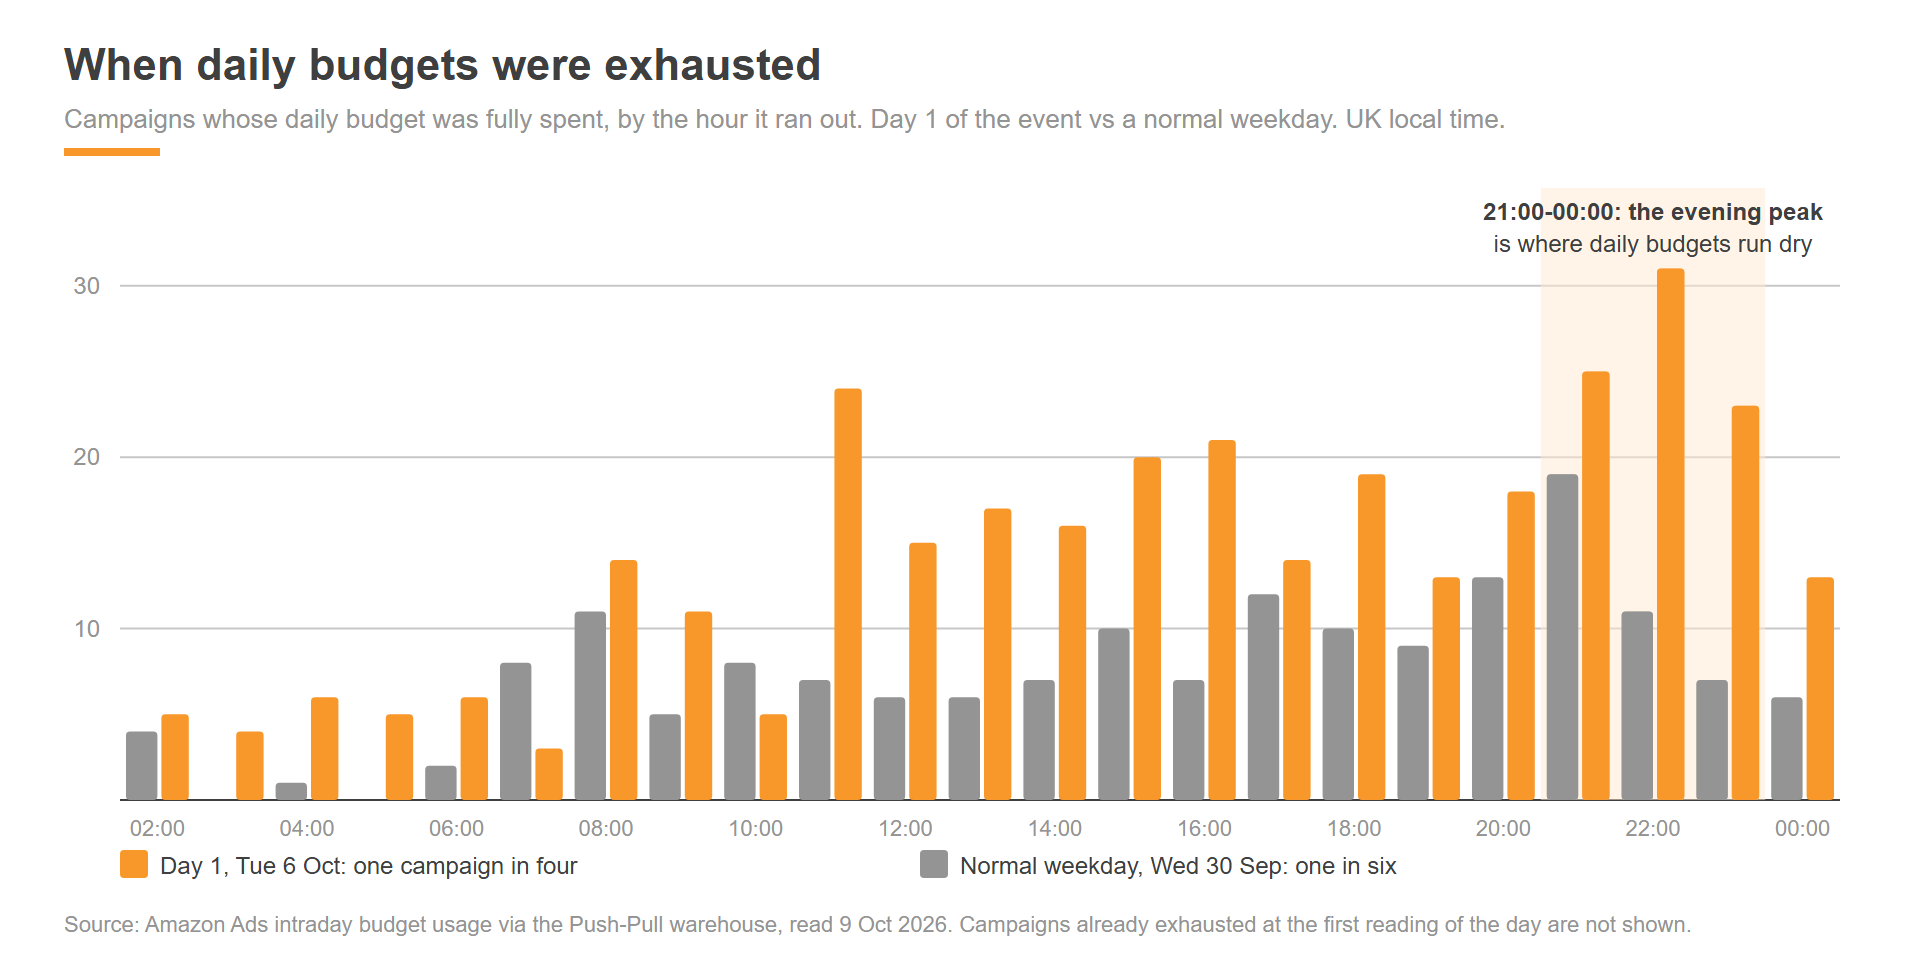
The largest block of day-one budget exhaustion fell between 21:00 and midnight UK, the evening peak from section 3. A daily number written for a normal day runs out exactly when the event is paying best. That is why we pace event budgets by the hour: the rules read the same feed and lift a budget in the hour a cap is forecast, so the evening is funded from the morning’s underspend rather than from a flat daily figure.
8. Deal volume concentrates, and the UK converts deal traffic at twice the EU rate
Amazon’s own deal performance report covers roughly 500 Best Deals across 17 of the seller accounts, in the UK, Germany, France, Italy, Spain and the Netherlands. Two patterns stand out.
Deal volume follows a power law. One deal in twenty carried 69 pct of every unit sold on a deal; the top tenth carried 83 pct. A deal badge amplifies a line that already converts. The practical lesson is to put the deal fee behind proven converters in the price band that responds (section 9), and to treat the long tail of a deal submission as the price of finding the winners.
| Market | Deals that ran | Deal units | Deal page views | Units per 100 page views |
|---|---|---|---|---|
| UK | 97 | 4,694 | 127k | 3.7 |
| Germany | 79 | 2,949 | 196k | 1.5 |
| France | 92 | 502 | 32k | 1.6 |
| Spain | 100 | 889 | 70k | 1.3 |
| Italy | 108 | 1,070 | 110k | 1.0 |
Deal shoppers browse differently by country. German deal pages drew the most traffic of any market and converted at well under half the UK rate; Italy, Spain and France sat lower still. EU event shoppers compare more and buy less per visit, which changes what a deal is for in those markets: it is a traffic event first and a sales event second, and the retargeting that follows it does the selling.
The halo is real but modest. Inside the 13 accounts that ran deals, deal lines lifted 5.4x in units and 4.5x in revenue. The full-price lines in the same accounts lifted 2.4x in units and 2.7x in revenue, against 2.2x on both measures for accounts that ran no deals at all. Deal traffic does spill onto the storefront and the variation family, but the spill is a fifth to a quarter, not a doubling. The deal line itself is where the event happens.
9. The sweet spot was 25 to 100 pounds
| Normal selling price | Lines | Unit lift | Realised price vs normal |
|---|---|---|---|
| Under GBP 10 | 148 | 1.7x | -6 pct |
| GBP 10-25 | 959 | 2.4x | -4 pct |
| GBP 25-50 | 513 | 3.7x | -16 pct |
| GBP 50-100 | 253 | 5.0x | -21 pct |
| GBP 100+ | 167 | 2.4x | -6 pct |
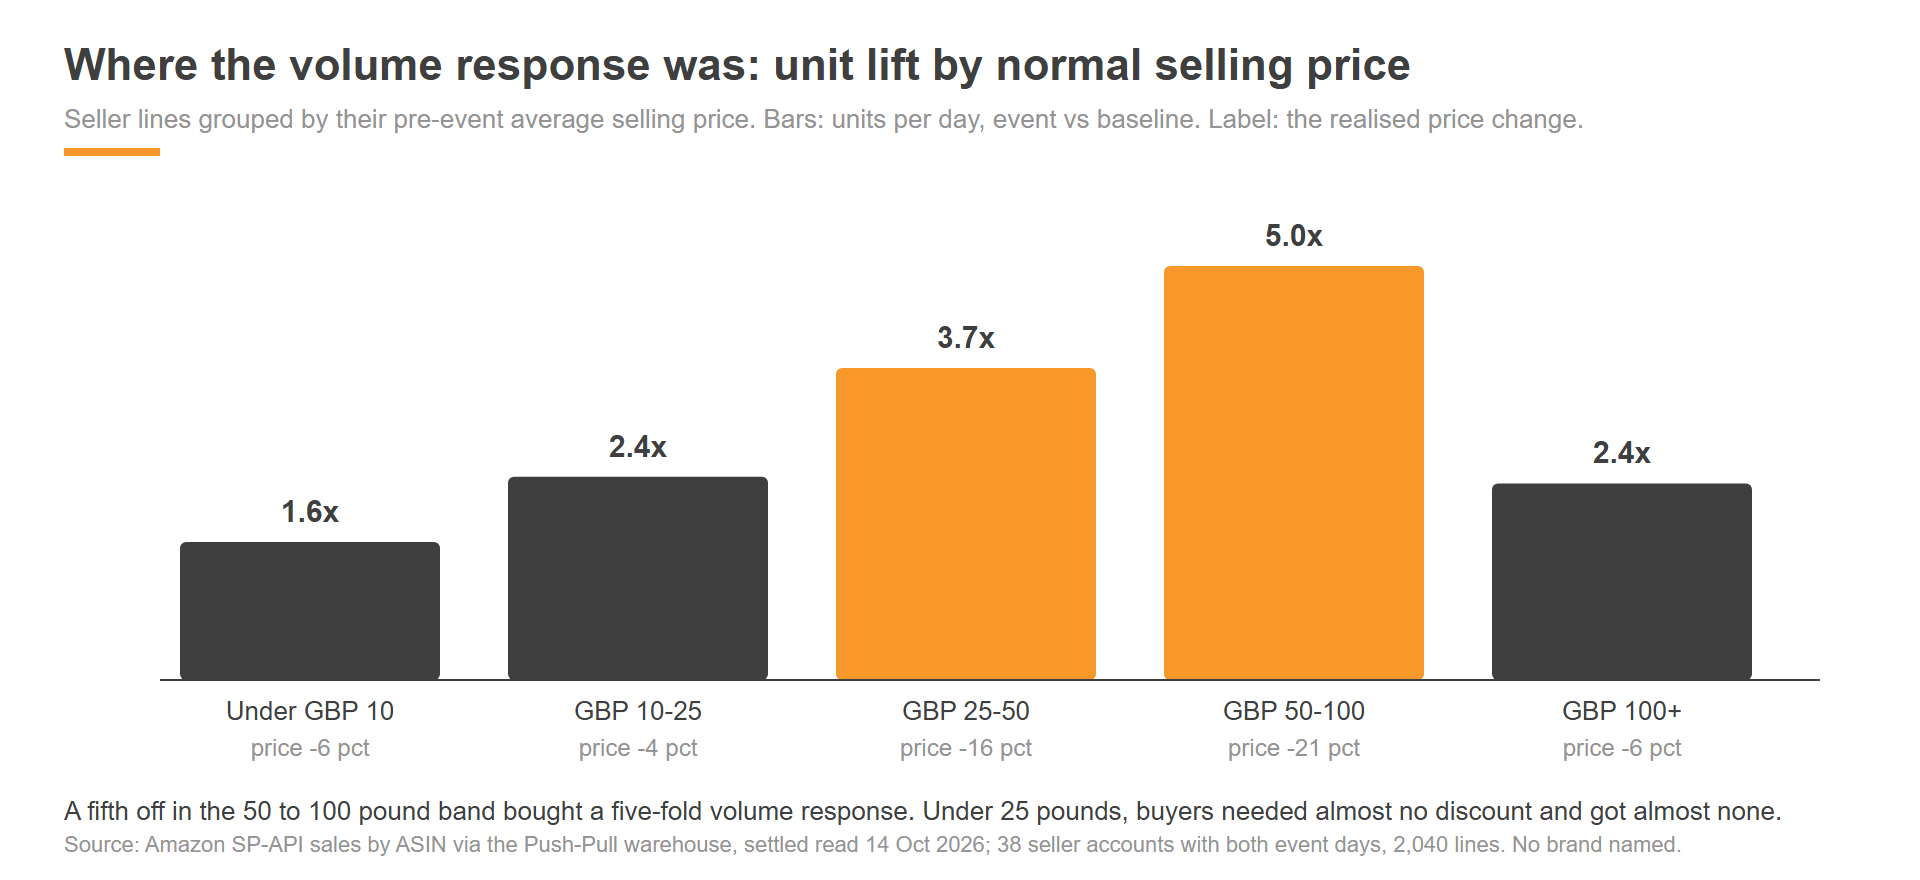
The 50 to 100 pound band is where a fifth off turned into a five-fold volume response; it is the band Amazon’s deal badges are built for. Under 25 pounds, buyers needed almost no discount and got almost none. The realised-price column is the discount the market actually gave, not the one that was submitted.
10. The week after: rank held, reviews came, prices went straight back
We compared every line’s last pre-event snapshot with its first read after the event (9 to 11 October): sales rank, review count, Buy Box share, third-party offers and price.
| Lines | ASINs | Better sales rank a week later | Rank at least halved | Gained reviews | Median new reviews | Still priced lower |
|---|---|---|---|---|---|---|
| On a Best Deal | 514 | 75 pct | 23 pct | 75 pct | +8 | 1.5 pct |
| Not on a deal | 9,186 | 36 pct | 10 pct | 19 pct | 0 | 8.6 pct |
Three things the event left behind on deal lines: a better sales rank a week later for three in four, a review count that moved for three in four, and prices that went straight back up. Two things it did not do: Buy Box share and third-party offer counts were unchanged on both sets, within a tenth of a point. The event did not invite a seller pile-in.
11. The lull before and the week after
- No lull. Seller revenue in the three days before the event ran at GBP 59.9k a day against a fortnight average of 59.6k. Vendor units ran at 100 to 104 pct of the fortnight. Buyers did not hold back for the event.
- Back to baseline the next day. Seller revenue returned to its baseline the day after. Vendor ordered units were 8 pct below baseline the day after and within 4 pct for the rest of the week.
- Shoppers kept browsing after the deals ended. Ad clicks ran 7 to 17 pct above baseline for five days after the event while click-to-order eased from 10.3 pct to between 7.5 and 8.6 pct. Event-primed shoppers were still comparing; the deals had gone and the reference prices had not reset in their heads. It is a bid question for the week after, not a budget question.
12. What this means for Black Friday
- Fund the morning and the evening of day one. 05:00 to 09:00 and 18:00 to 22:00 local together carried 45 pct of day-one ad sales. Pace budgets by the hour, not the day.
- Set EU bid ceilings separately. France, Spain, Germany and Italy inflated 33 to 80 pct, the UK 15 pct. One ceiling does not fit.
- Concentrate the deal fee. One deal in twenty carried two-thirds of deal units. Put the badge behind proven converters in the 25 to 100 pound band.
- Treat EU deals as traffic events. German deal pages out-drew every market and converted at well under half the UK rate; plan the retargeting that follows the badge.
- Price the event honestly. Expect ACOS up about five points and advertising taking about 10p in the sales pound rather than 8p. The return is volume, rank and reviews, not efficiency.
- Expect the shape, not just the size. About 2x on vendor lines from Amazon’s own merchandising, about 3x on seller lines with a deal programme in place, and a week of comparison shopping afterwards: pull bids back, not budgets.
Method
Window 22 September to 7 October 2026: a 14-day baseline against the two event days. Year-ago comparison 23 September to 8 October 2025 on the 22 seller accounts present in both. Seller figures use the 38 seller accounts (22 brands, 5,660 ASINs) with settled Amazon reports for both event days. Vendor: 16 brands, 35 account-marketplaces, 3,595 ASINs. Advertising: 30 brands, 66 account-marketplaces, 2,677 campaigns; hourly figures from the Amazon Marketing Stream, daily figures from the Ads API reports, both converted to GBP at the daily rate. Deals: Amazon’s promotion performance report for 17 seller accounts (deals that ran; one India deal excluded). Post-event rank, review and price reads from a weekly price-history snapshot. Market-wide searches: Amazon Brand Analytics Top Search Terms at daily grain, 4 to 8 October, UK, DE and US (every search clearing Amazon’s reporting threshold, with the top clicked product’s click share); the week-before panel is Brand Analytics Search Query Performance on the queries present in all five weeks to 3 October. Marketplaces: UK, DE, FR, IT, ES, NL, US, IN. Ad-attributed sales use Amazon’s 14-day window, which closes on 21 October for the event days; the figures here were read on 14 October after the 7-day restatement. No client is named and no client brand is identifiable from the category or price-band cuts; brand names quoted in section 4 are public search terms on the marketplace.
Frequently asked questions
How much did Amazon sales lift on Prime Big Deal Days 2026?
Across 38 seller accounts with settled Amazon reports, revenue ran at 3.1 times the daily baseline over the two days. Vendor lines in the UK ran at 1.9 times. The matched set of 22 seller accounts lifted 2.5 times in 2025 and 3.1 times in 2026.
When did shoppers buy during Prime Big Deal Days?
On day one the biggest relative lift was between 05:00 and 09:00 UK, at 3.5 to 4.7 times a normal hour. The evening from 18:00 to 22:00 carried 28 to 29 per cent of each day’s ad-attributed sales against 24 per cent on a normal day.
How much did Amazon advertising costs rise during the event?
Cost per click rose 25 per cent overall: 15 per cent in the UK, 11 per cent in the US, and between 33 and 80 per cent across Germany, Italy, Spain and France. Click-to-order rate held at 10.3 per cent and ACOS rose about five points.
Which deals sold on Prime Big Deal Days?
Deal volume followed a power law: one deal in twenty carried 69 per cent of deal units and the top tenth carried 83 per cent. UK deal pages converted at 3.7 units per hundred page views against 1.0 to 1.6 in Germany, France, Spain and Italy.
What happened in the week after Prime Big Deal Days?
Three in four deal lines held a better sales rank a week later and three in four gained reviews, while fewer than two per cent were still discounted. Ad clicks stayed above baseline for five days while click-to-order eased to between 7.5 and 8.6 per cent.
Talk to our experts. If you sell on Amazon and want this read on your own account before Black Friday, ask us about the Platinum Audit.